At-a-Glance Weather Obs for the Polar Winter
Every morning and every night Ice Team leader Brian Newham braves the outside – no matter what the weather is throwing at him – to take meteorological observations as part of our very many scientific projects during the expedition. These then get sent back to the Met Office in the UK for analysis and archiving.
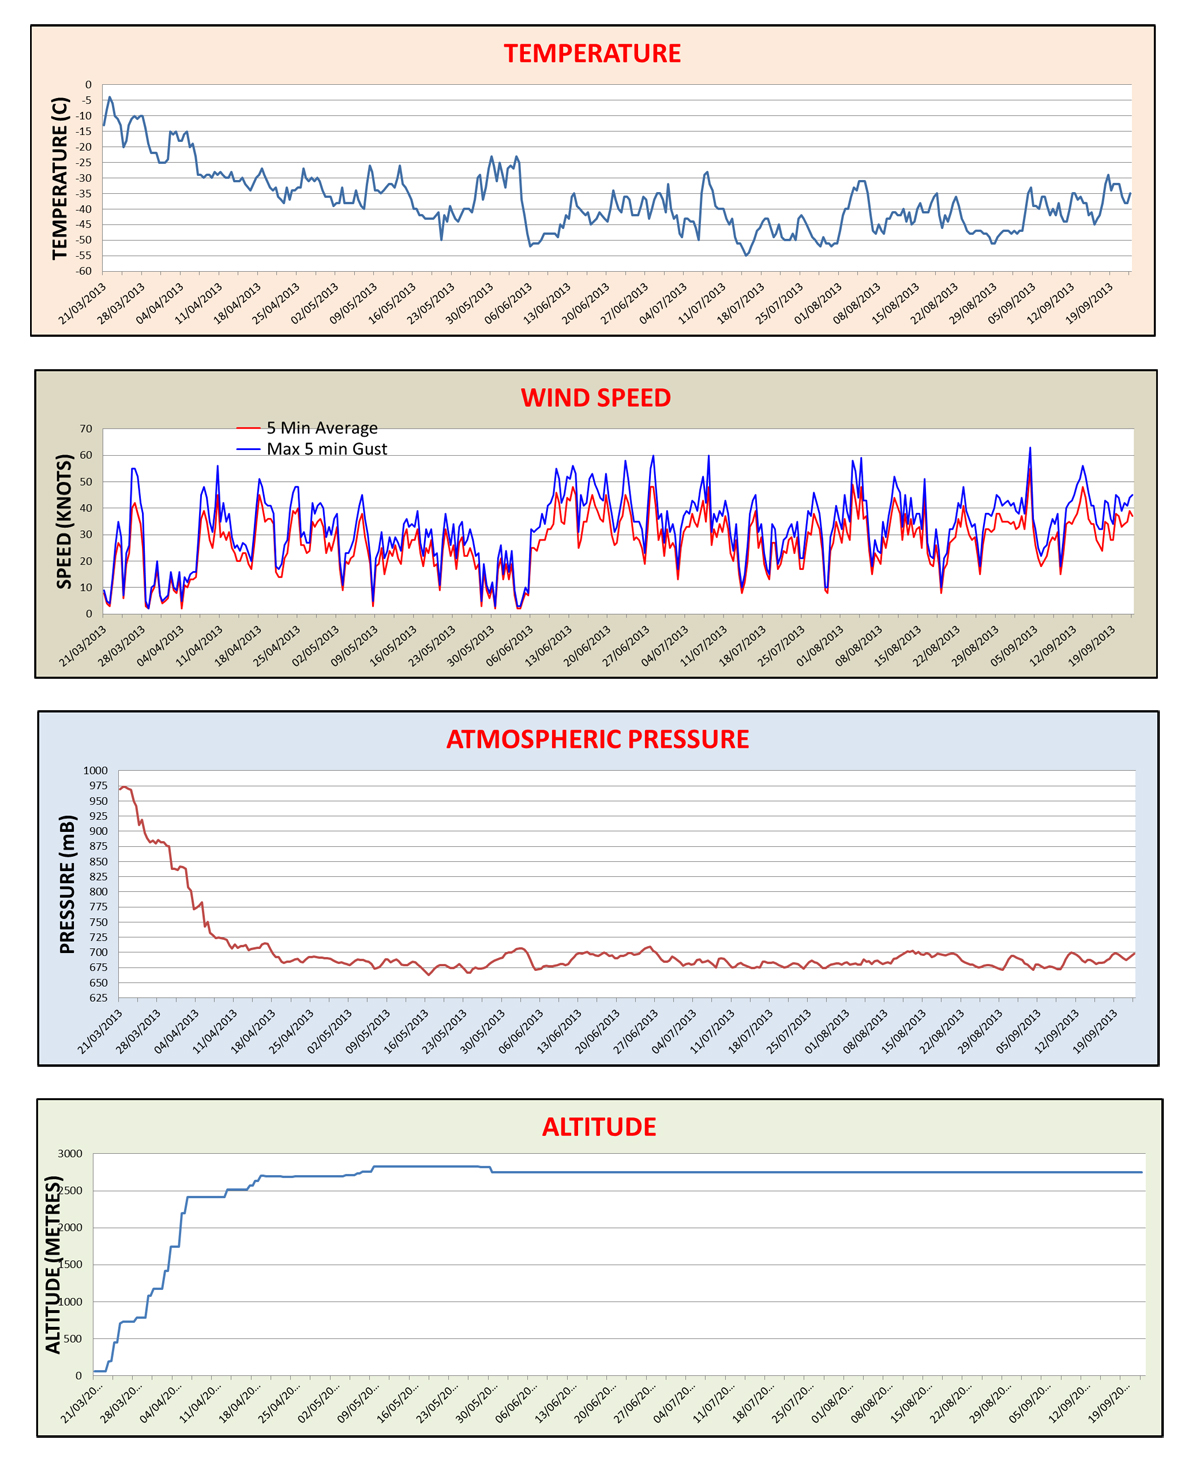
Today, we can share the bulk of Brian’s findings with these four graphs charting the temperature, wind speed, atmospheric pressure and altitude during the six-month Antarctic polar winter that has ended.
Thank you Brian for sharing these fascinating findings and for getting out in the cold every day, twice a day, and often when the others were still warm and asleep in their bunks!

Comments are closed